Create subgroups based any other genomic data
Xena's powerful text-based search allows users to dynamically highlight, filter, and create subgroups of samples.
Xena's search bar at the top of the Visual Spreadsheet allows you to find samples and then either filter so only those samples are in view, or create subgroups. The search bar allows you can search the data on the screen similar to the ‘find’ functionality in Microsoft Word. Samples are matched and highlighted in real-time as you type.
Subgroup columns behave like any other column and can be used in a Kaplan-Meier analysis, box plot, or other statistical analyses to compare the two groups of samples. This is a powerful way to dynamically construct two sub-populations based on any genomic data for comparison and analysis.
Example: MET splice variants in TCGA lung adenocarcinoma


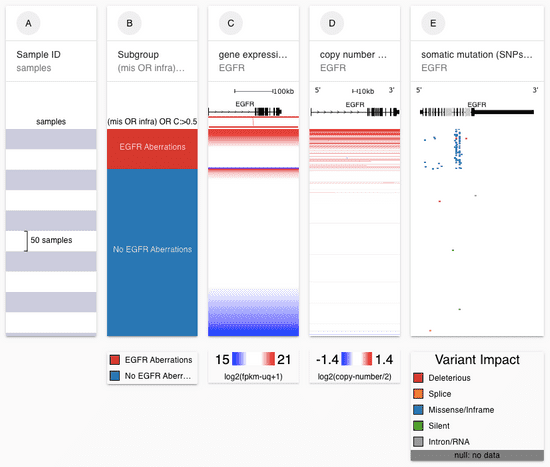
Xena's subgroup samples functionality.
In the first image, a user has made two subgroups: samples that have a missense or in-frame insertion/deletion in EGFR or have a copy number amplification of EGFR and samples that do not have either of these. They have named these subgroups 'EGFR Aberrations' and 'No EGFR Aberrations'.
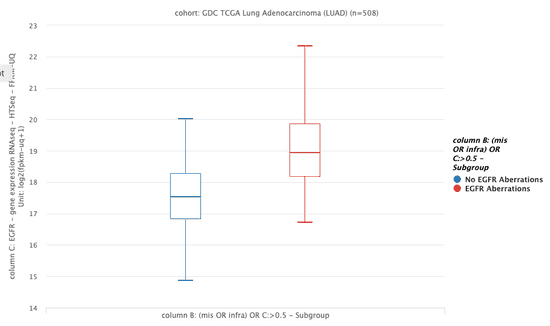
In the second image, we compare gene expression between the two subgroups. We see that those samples with aberrations tend to have higher expression that those without aberrations.

