Discover relationships among genomic and clinical data
Wondering if an increase in gene expression is correlated with a promoter hypomethylation, an increase in chromatin accessibility, or hotspot missense mutations? Xena lines up multiple types of data side-by-side to help you discover relationships.
Easily compare any -omic data within a gene or transcript, or across different genes. Our visualizations are designed to offer incredible flexibility, allowing you to see exactly the data you want to see. Use Xena to find and show patterns between genes or between genomic and phenotype information.
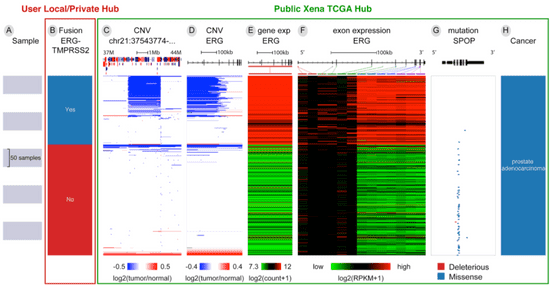
Example: ERG-TMPRSS2 gene fusion in TCGA prostate cancer

In this example a user downloaded ERG-TMPRSS2 fusion calls from Gao et al. 2018 (n=492), loaded the data into their own local Xena Hub (column B), and then compared the fusion calls to public gene expression and copy number data from the same sample set (columns C-H).
Columns C and D are the copy number variation status, first of a zoomed in region of chromosome 21 and second of just the ERG gene. The gene diagram at the top with exons in black boxes, tall coding regions, and shorter untranslated regions. Amplifications are in red and deletions are in blue.
Columns E and F are gene expression, first for the ERG gene and second for each of the exons of the ERG gene. They are colored red to blue for high to low expression.
Column G is SPOP mutation status and also has a gene diagram at the top. The position of each mutation is marked in relation to the gene diagram and colored by its functional impact: deleterious mutations are red, missense and in-frame INDELs are blue, splice mutations are orange, and synonymous mutations are green.
Here we can see that the fusion calls are highly consistent with the characteristic overexpression of ERG (columns E, F). However, only a subset of those samples in which a fusion was called can be seen to also have the fusion event observed in the copy number data via an intra-chromosomal deletion of chromosome 21 that fuses TMPRSS2 to ERG as shown in columns C and D. This observation is consistent with the 63.3% validation rate described in the paper. SPOP mutations (blue tick marks in column G) are mutually exclusive with the fusion event.

