Kaplan-Meier survival analysis on any data
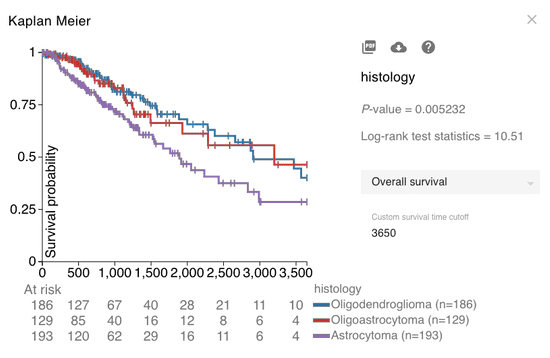
We have p-values, multiple survival endpoints, an 'At risk' table, and custom time cutoffs.
Whether you're looking at DNA, RNA, methylation or protein, we can help you determine if a gene affects survival. Stratify your samples by any genomic or phenotypic data (e.g. expression, copy number, subtype, age, etc) and determine if there is a statistically significant survival difference.
Example: KM analysis for TCGA lower grade glioma histological subtypes

TCGA lower grade glioma patients characterized as having the astrocytoma histological subtype have significantly worse 10-year overall survival compared to the oligodendroglioma and oligoastrocytoma subtypes (p < 0.05). You can download a PDF as well as the underlying data to further customize the figure in an application outside of Xena.

